The student dashboard contains the data necessary for instructors to gain personalized insight about individual students in order to design specific interventions or instructional plans. This dashboard contains numerous interactive visualizations that enable instructors to gain awareness of their students' course performance and behavior. The dashboard highlights patterns and indicators about an individual student and their position relative to course expectations and other students within the course.
The student dashboard is divided into two main sections: individual student information and predictive charts.
Access a student's individual predictions by clicking on their name in the class dashboard.
Return to the class dashboard by clicking Student Success System in the tool navigation.
Individual student information
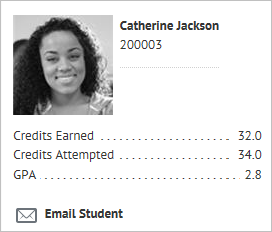
Basic information about the student displays here. This includes their profile picture, name, and campus ID (also known as the OrgDefinedId). If the institution permits access to additional data elements from a Student Information System (SIS) integration, they will also display here.
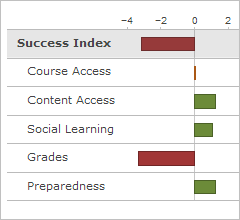
Win-loss chart
A win-loss chart displays beneath the student information. The win-loss chart lists the domains in the predictive model and shows a student's predicted success level in each domain for the week. The Student Success System determines the predicted success level by examining the success rates of students from historical courses in the predictive model and comparing the behavior of historical students with current students. For example, if successful students in historical courses trended toward high participation in course discussions, then the system will predict that students who actively participate in course discussions are more likely to succeed in the course than students who do not actively participate in course discussions. An instructor who notices students falling into the At Risk or Potential Risk category for the Social Learning domain can take steps to encourage those students to participate more frequently in discussions as a way to preemptively address potential course success issues.
The vertical center line in the chart corresponds to the average of the Potential Success range (for example, if the range for Potential Success is 60%-80%, then the average is 70%). Every domain in the win-loss chart displays a bar that you can compare to this center line; if the bar for the domain falls on the positive side of the line, then the student's performance exceeds the average (70%) in that domain for the week. However, if the bar for the domain falls on the negative side of the line, the student is not performing successfully in that domain for the week. Each domain contributes to the overall value of the Success Index.
The Student Success System includes three predictive charts:
Click on the name of the predictive chart you want to view in the win-loss chart.
The Success Index predictive charts consists of a Course Timeline chart and a Risk Quadrant. These display by default when you access a student dashboard.
The Course Timeline chart shows the weekly Success Index for a student in the course, providing an at-a-glance view of their academic trends. Each week is color-coded to correspond with the student's actual success level for that week.
The Risk Quadrant positions a student within the class based on their current Success Index and Final Calculated Grade.
Note In order for data to display properly in the Risk Quadrant, enable your course grade book to Automatically keep final grades updated. See Changing Calculation Options for more information.
This chart represents each student from the course as a colored circle corresponding to their current risk category status.
The Risk Quadrant is divided into the following four sections:
The Sociogram is a social learning predictive chart that provides a visualization of a student's social network based on their interactions in class discussions.
The Sociogram represents students as colored circles. Connecting lines between circles indicate that students have communicated with each other via a post/reply interaction in the Discussions tool. The size of a student's circle is proportional to the amount of communications the student has exchanged with other students, while the color indicates which risk category the student falls into for the domain.
The Sociogram enables you to view the circle in two ways:
Click Show Names to display the names of all the students in the course.
The Grades predictive chart provides a compact visualization of a student's performance across all course assessments, while also comparing performance relative to their classmates.
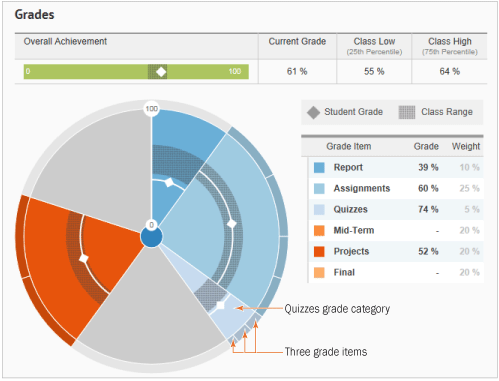
A general view of the Grades predictive chart
Each slice of the Grades chart corresponds to a grade item or a category of grade items (for example, Projects or Quizzes). The size of each slice corresponds to the overall weight of the grade item or category. If a particular slice corresponds to a category of grade items, its outer edge is broken into as many sections as there are grade items. For example, in this chart, the Quizzes slice indicates that there are three grade items associated with the category. You can click on slices that contain multiple grade items to view a chart focusing on those grade items. To return to the general view of the Grades predictive chart, click on the center of the chart.
