The User Progress tool helps track student progress in a course by measuring their completion of 9 different progress indicators. Instructors can use User Progress to track their students' overall progress and prepare progress reports, while students can use User Progress to keep track of all of their course-specific assignments and feedback. Progress reports are available for the following progress indicators:
The User Progress interface consists of three main areas:
The User Progress tool is accessible from both My Home and the course level. From My Home, students can access their own progress reports for all of the courses they have active enrollment in. At the course level, both instructors and students can access user progress reports for the course they are currently in, although students can only view their own progress.
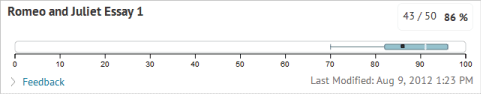
The Grades box plot graph
The Grades box plot graph represents the full range of possible grades (0%-100%) in one bar. The ![]() start and
start and ![]() end brackets represent the actual range of grades for the item. The start bracket represents the lowest grade achieved for the grade item, while the end bracket represents the highest grade achieved for the grade item. The blue bar represents the middle range of grades for the class, excluding the bottom 25% of the class and the top 25% of the class. A black square (
end brackets represent the actual range of grades for the item. The start bracket represents the lowest grade achieved for the grade item, while the end bracket represents the highest grade achieved for the grade item. The blue bar represents the middle range of grades for the class, excluding the bottom 25% of the class and the top 25% of the class. A black square (![]() ) represents the individual user's grade for the item. Their grade also displays numerically, along with any previously established grade and color schemes. A vertical white line (
) represents the individual user's grade for the item. Their grade also displays numerically, along with any previously established grade and color schemes. A vertical white line ( ![]() ) represents the mean grade for the item.
) represents the mean grade for the item.
